
Dedicated Instance Analytics
The Dedicated Instance Analytics and visualization capabilities allow you to monitor the overall call quality and details of the end-point usage. Dedicated Instance Analytics visualization and reports give administrators insight into the setup, efficiency, and overall use of their calling devices. Admins can use this insight and reports to drive their decisions.
As a full administrator, read-only administrator, or support administrator of an organization, you can:
- Access various reports in Control Hub, depending on your deployment.
- Use the information to evaluate how Dedicated Instance services and devices are being used in your organization and how often.
- Use analytics to track and measure services in your cloud collaboration portfolio.
- Export reports as a PDF, PNG, or CSV.
The Dedicated Instance Analytics displays the Overview cards of all the categories. The Dedicated Instance Analytics cards are categorized based on the following:
- Service Experience
- Asset Usage
- Traffic Analysis
- Capacity Analysis
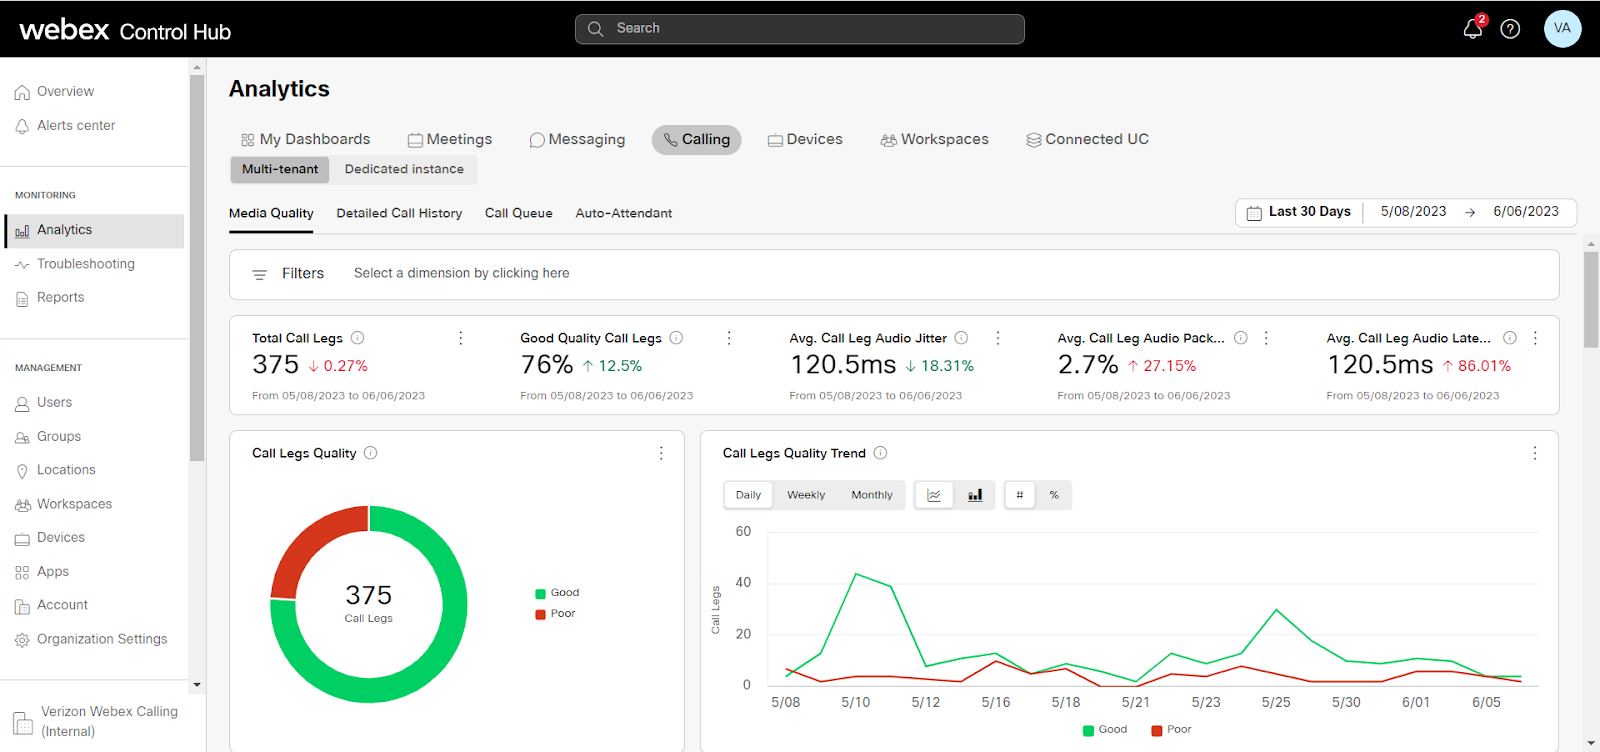
Service Experience
The Service Experience dashboard helps you to analyze the service quality distribution and traffic trends based on the number of calls, location, or call duration.
The CMR must provide Severely Concealed Seconds (SCS) values. This is required for grading the quality of the calls.
The device details for this are collected from Dedicated Instance, and the call quality details are obtained from CDR.
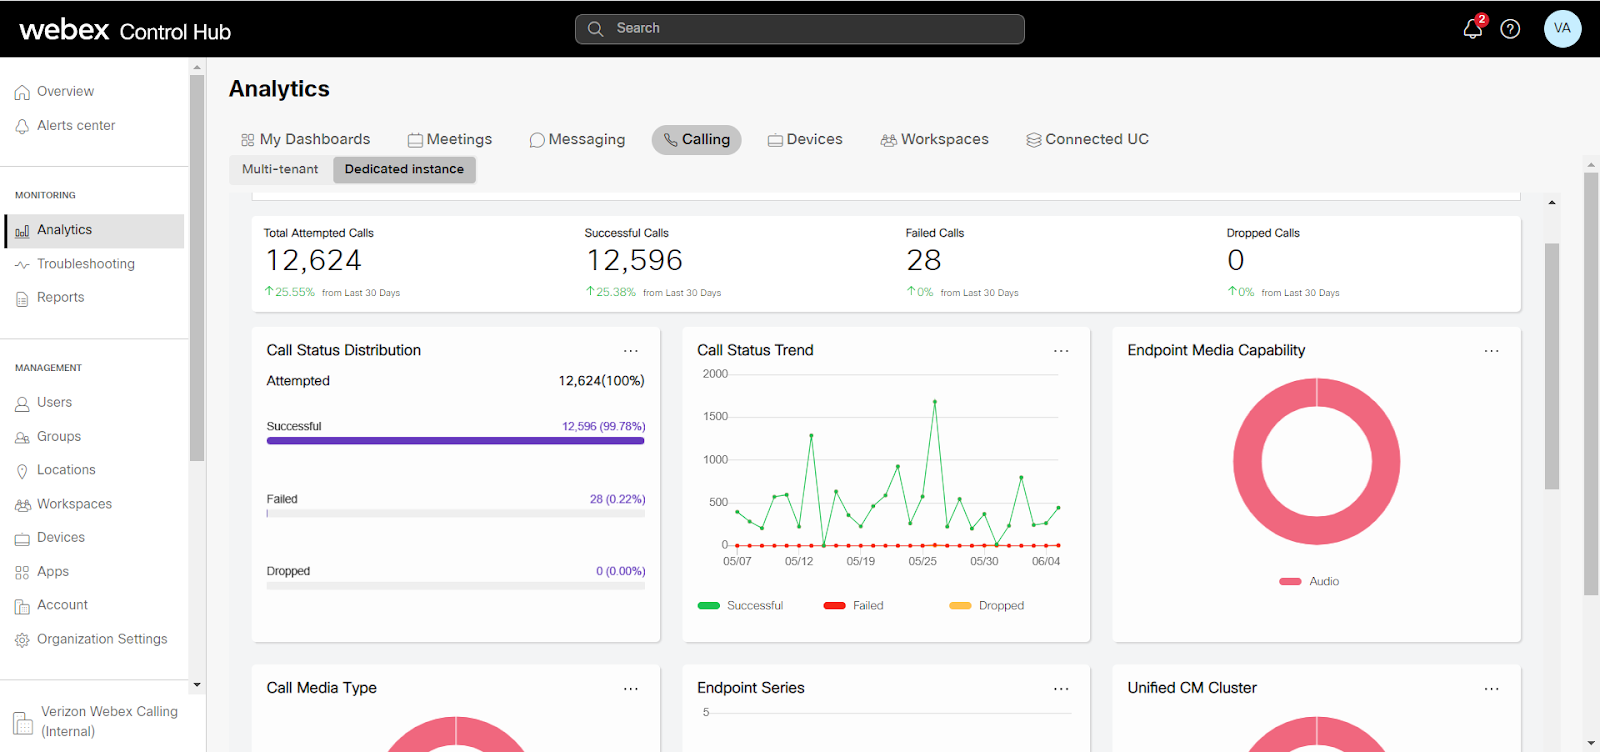
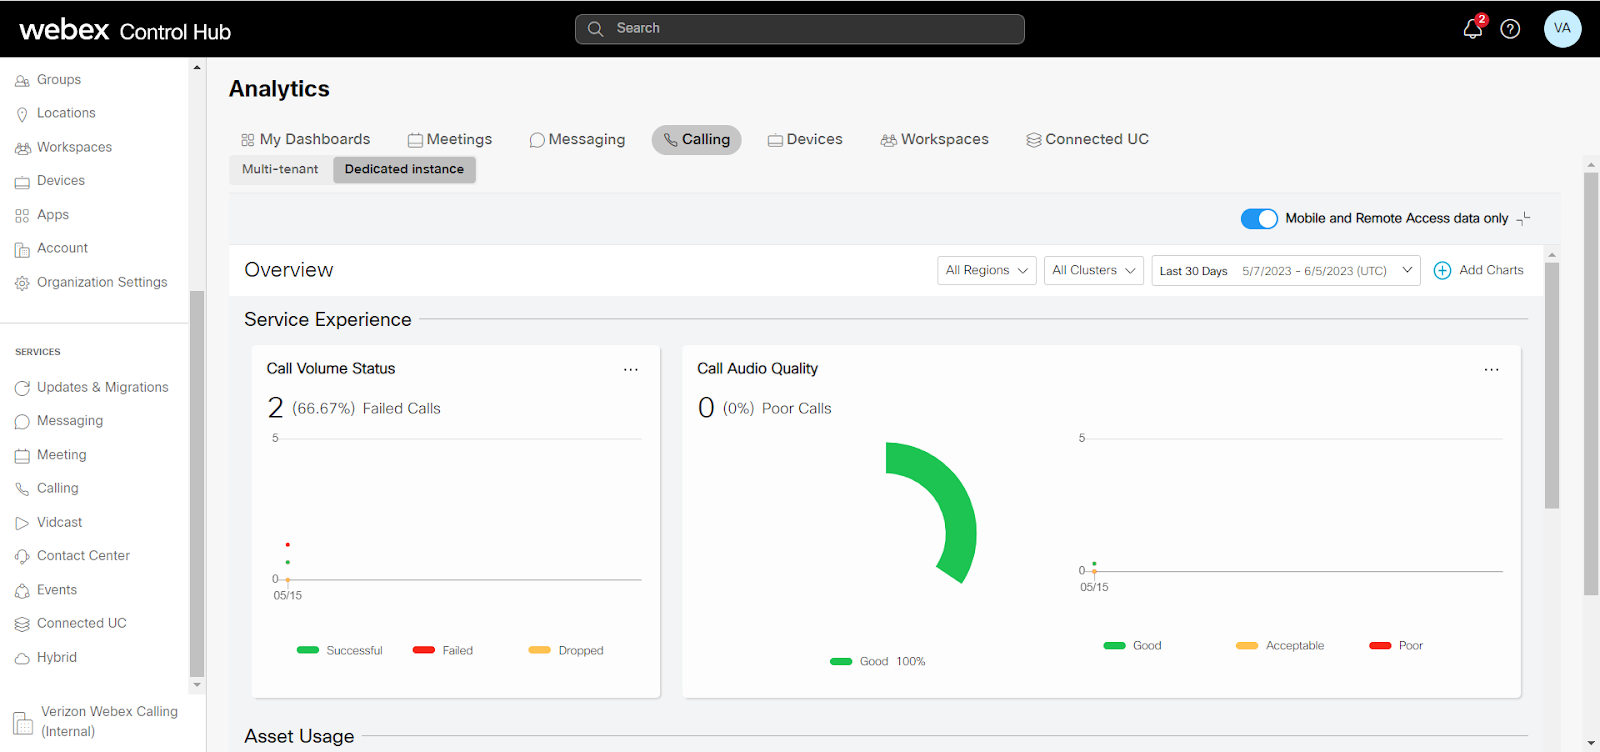
Call Volume Status
- From Control Hub, go to Analytics > Calling > Dedicated Instance.
- Go to the Service Experience dashboard.
- Click the Call Volume Status card to view the information about call completion in terms of attempted, successful, failed, and dropped calls. You can select various filters to visualize charts based on your selection.
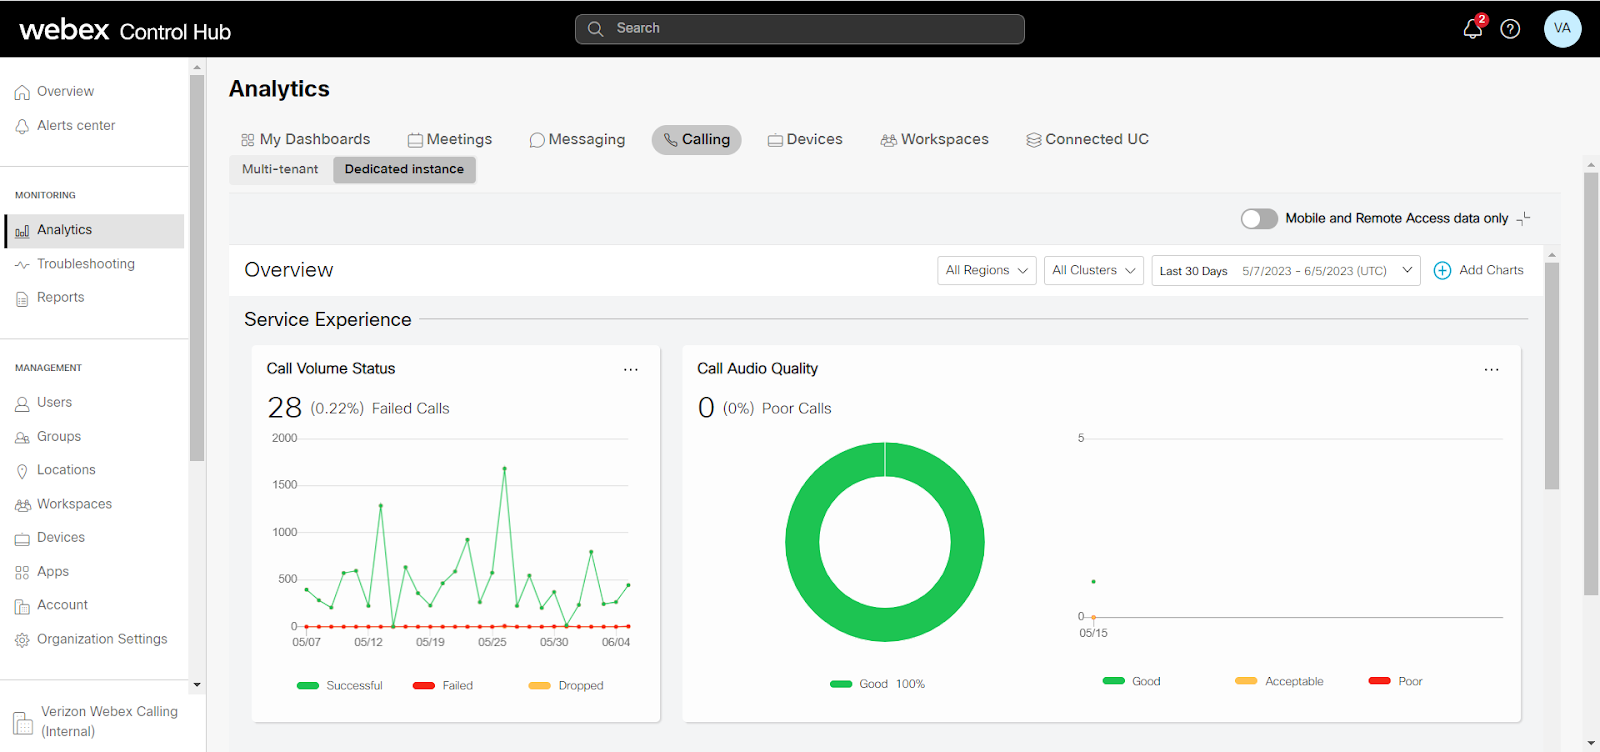
Call Audio Quality
- From Control Hub, go to Analytics > Calling > Dedicated Instance.
- Go to the Service Experience dashboard.
- Click the Call Audio Quality card to view the information about call quality.
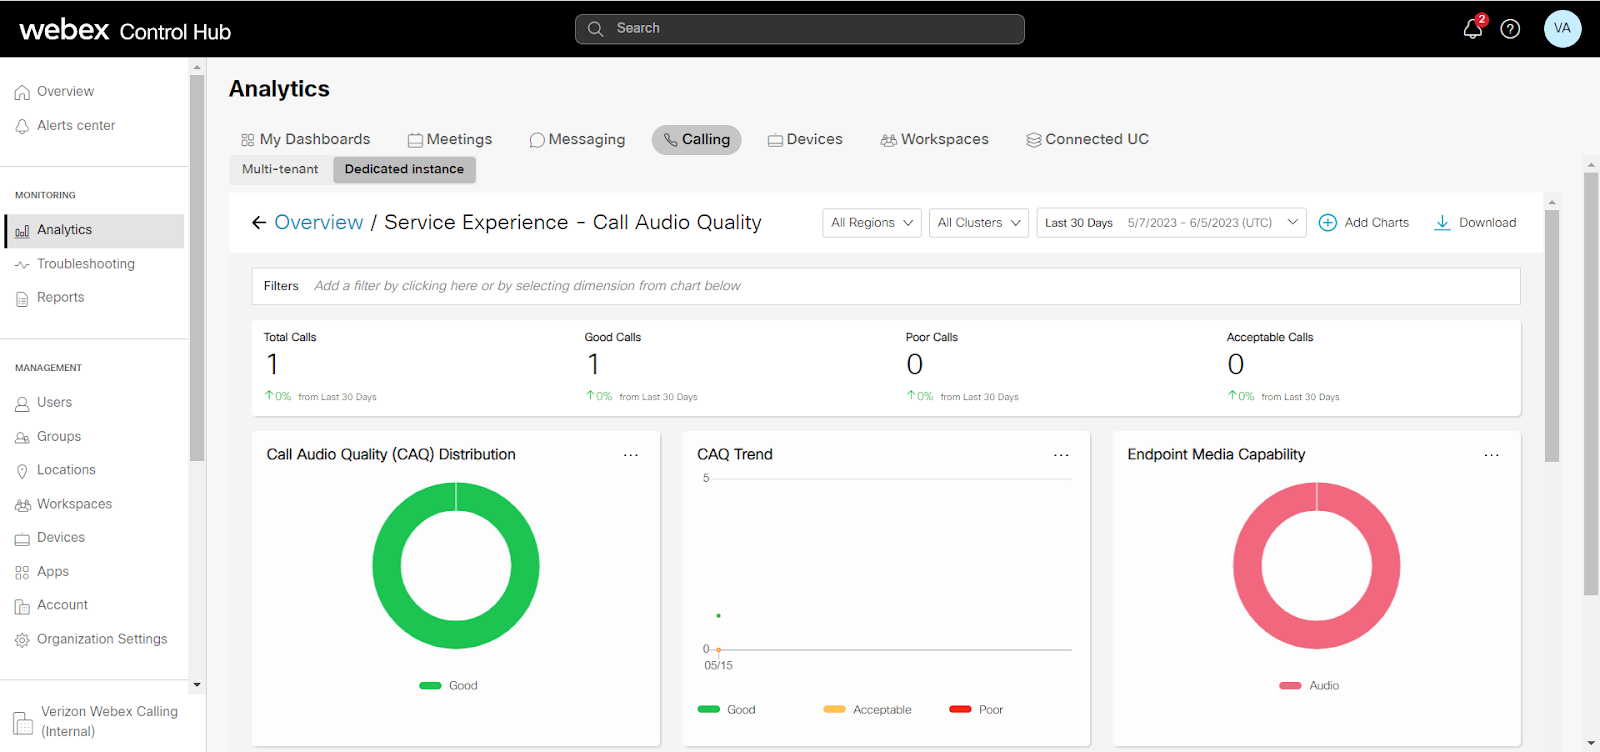
You can select various filters to visualize charts based on your selection.
Asset Usage
The Asset Usage dashboard displays the charts for the endpoints and headsets usage in your organization. The CDRs, CMRs, and device details for this are collected from the Dedicated Instance.
Calls that are not made using an endpoint are not shown or included in the asset usage charts. For example, trunk-to-trunk or conference bridge. Hence, Asset Usage charts do not show any data for SME type of Dedicated Instance clusters.
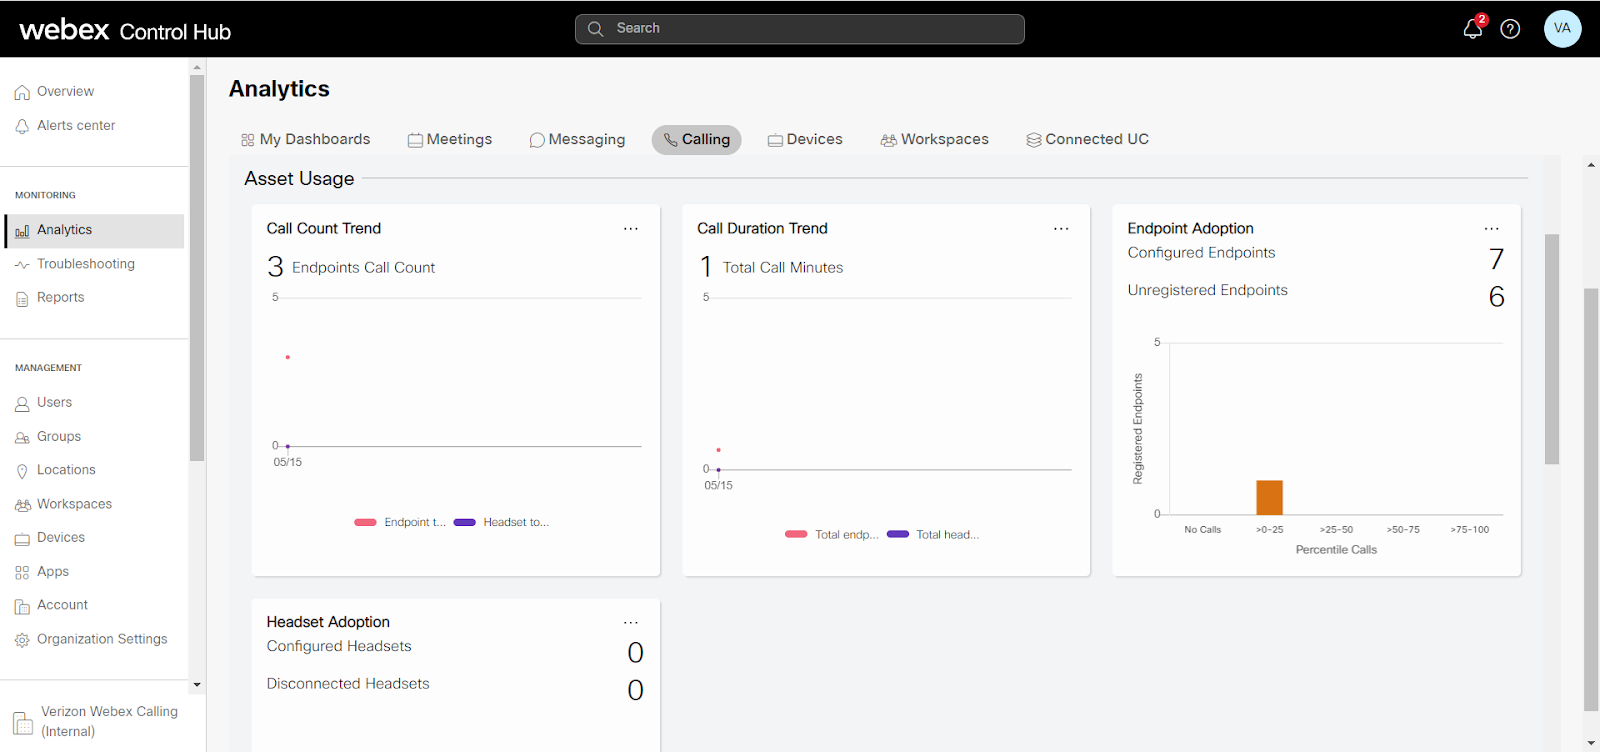
Call Count Trend
- From Control Hub, go to Analytics > Calling > Dedicated Instance.
- Go to the Asset Usage dashboard.
- Click the Call Count Trend card to view the charts that are related to the endpoints from the selected Dedicated Instance cluster.
You can select various filters to visualize charts based on your selection.
Call Duration Trend
- From Control Hub, go to Analytics > Calling > Dedicated Instance.
- Go to the Asset Usage dashboard.
- Click the Call Duration Trend card to view the charts that provide information about the duration of calls where endpoints and headsets have been involved.
You can select various filters to visualize charts based on your selection
Traffic Analysis
The Traffic Analysis dashboard displays the charts related to Call Traffic Locations and Call Traffic Analysis.
The Call Traffic Locations displays the distribution of calls that are handled by assets, categorized based on Call Admission Control (CAC) location, whereas the Call Traffic Analysis displays the distribution of calls that are handled by assets, categorized based on different Call Types.
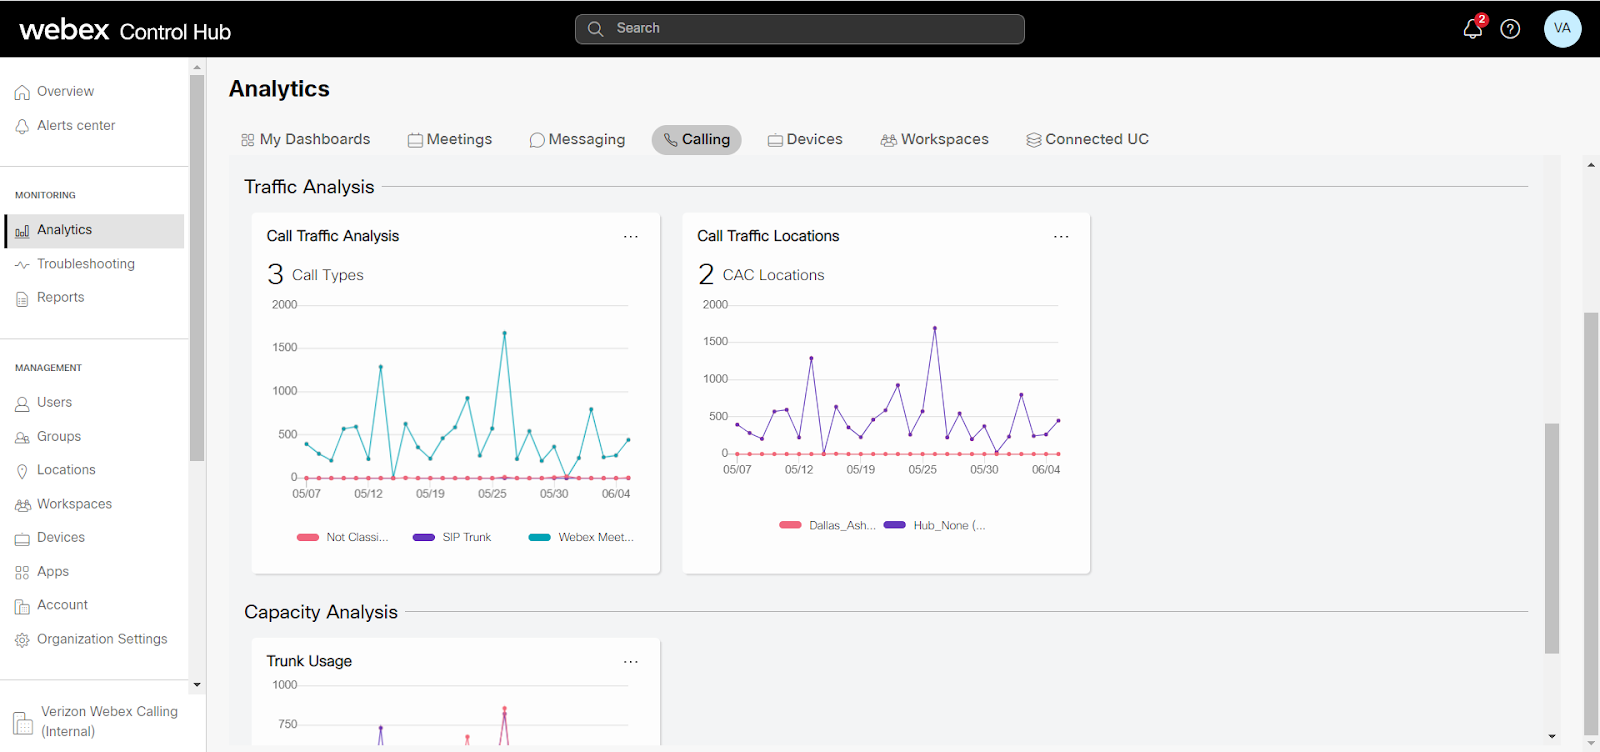
Call Traffic Locations
- From Control Hub, go to Analytics > Calling > Dedicated Instance.
- Go to the Traffic Analysis dashboard.
- Click the Call Traffic Locations card to view the information about call distribution based on Call Admission Control (CAC) location.
You can select various filters to visualize charts based on your selection.
Call Traffic Analysis
- From Control Hub, go to Analytics > Calling > Dedicated Instance.
- Go to the Traffic Analysis dashboard.
- Click the Call Traffic Locations card to view the information about call distribution analysis based on call types.
- The supported call types are P2P, ICT, SIP Trunk, Conference, MGCP, Voice Mail, Hunt Group, Webex Meeting, and Hybrid Calls.
- For a call to be classified as ICT type, the telemetry module must be installed on the trunk destination node.
- When a call is not recognized as any of the supported call types, it is marked as Not Classified.
- The supported call types, Hunt, Webex, Conference, and Voicemail, require you to enable PII.
- You can select various filters to visualize charts based on your selection.
Capacity Analysis
The Capacity Analysis dashboard displays the analytics charts related to Trunk Usage.
The Trunk Usage analytics chart displays information about Trunk Usage for the top five trunks from all the Trunk types that are configured within a Call Manager.
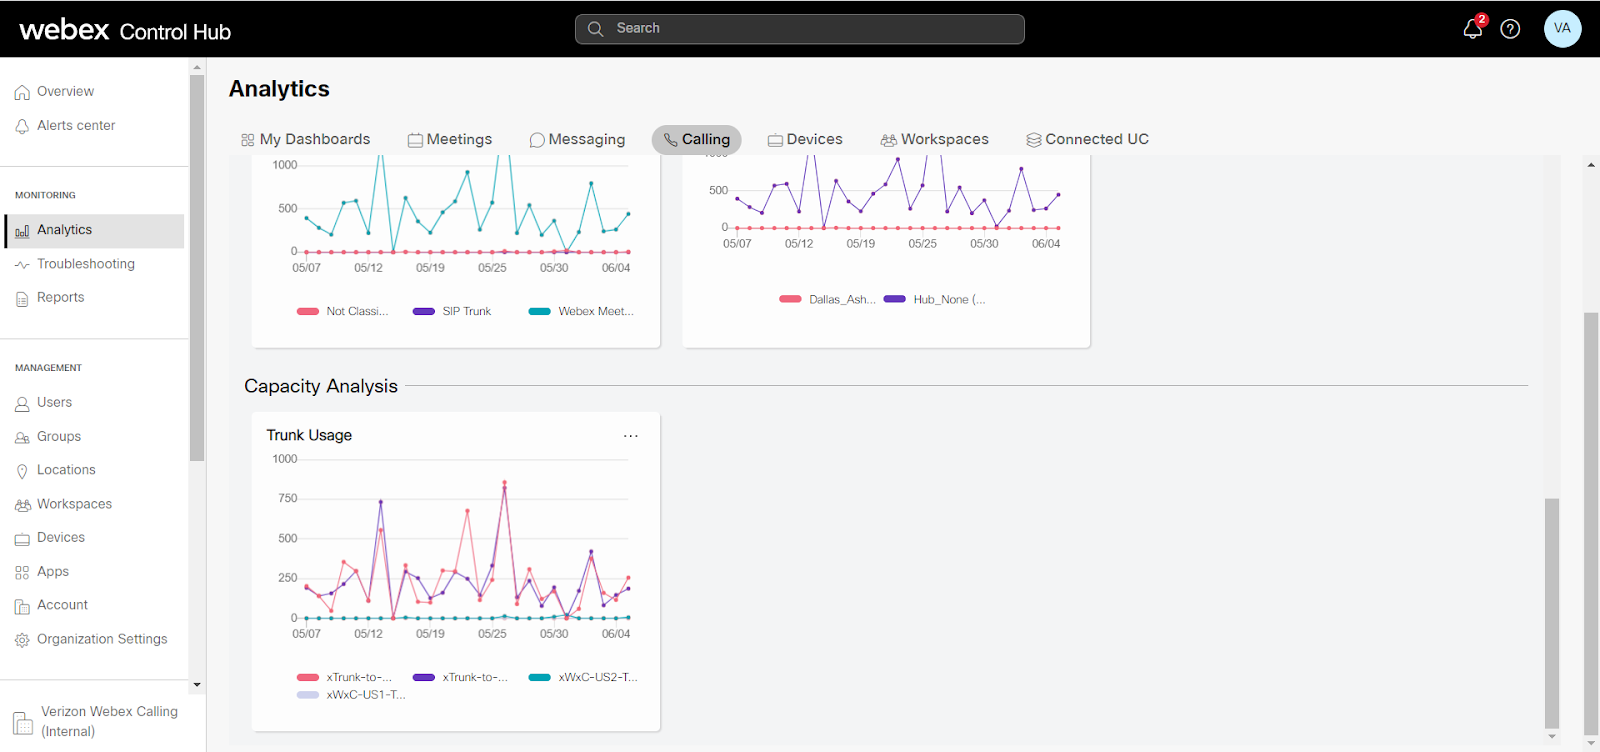
Trunk Usage
- From Control Hub, go to Analytics > Calling > Dedicated Instance.
- Go to the Capacity Analysis dashboard.
- Click the Trunk Usage card to view the information about Trunk Usage for all the Trunk types configured within a Call Manager.
You can select various filters to visualize charts based on your selection.
The Trunk Usage also displays the Trunk Peak Utilization table per the Call Count and Call Duration. You can select a trunk and click Set max con. calls to set maximum concurrent calls.
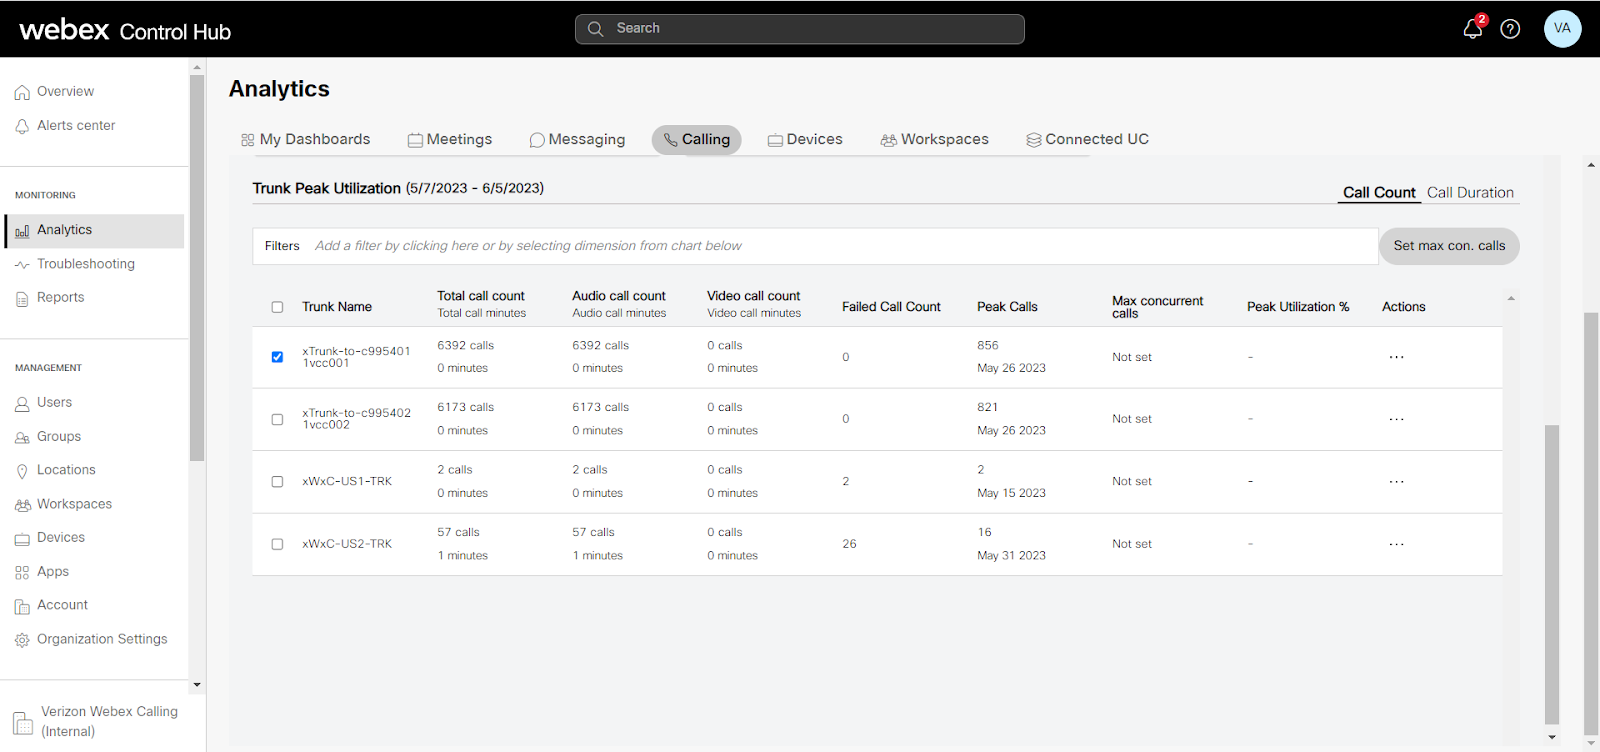
You can set max concurrent calls for a particular trunk and multiple trunks.
To set max concurrent calls for a particular trunk, click the three dots under the Actions column allowed for that trunk.
To set max concurrent calls for multiple trunks, select the trunks and click Set max con. calls to set the value for all the selected trunks.
The following are a few of the use cases for setting max concurrent calls:
- MGCP Gateway: The maximum capacity can be set based on the line terminations on gateways.For example, if the MGCP gateway is configured with T1, and all 24 ports are configured in CUCM, the maximum capacity can be set to 24.
- Inter-Cluster Trunk: The maximum call capacity of the trunk can be set based on the WAN capacity, the allocated bandwidth for Audio/Video/Data, the codec in use, and so on.
- SIP Trunk: The maximum call capacity of the trunk can be set based on the purchased call limit for the trunk as per the agreement.
- Expressway Trunk: The maximum call capacity of the trunk can be set based on the capacity of Expressway nodes or clusters.
The Trunk Peak Utilization table displays the following details:
{{dedicated-instance-analytics="/compontents"}}
Run Analytics
The Dedicated Instance Overview page displays the cards related to Service Experience, Asset Usage, Traffic Analysis, and Capacity Analysis.
- From Control Hub, go to Analytics > Calling > Dedicated Instance.
The Dedicated Instance Overview page appears. - You can select Multi-tenant to look into multi-tenant analytics visualization.
- Based on the services that have been enabled, you can select Messaging, Calling, Devices, and Detailed Call History from the Analytics menu for specific Analytics visualization.
- To view the analytics for MRA data, enable the Mobile and Remote Access data only toggle.
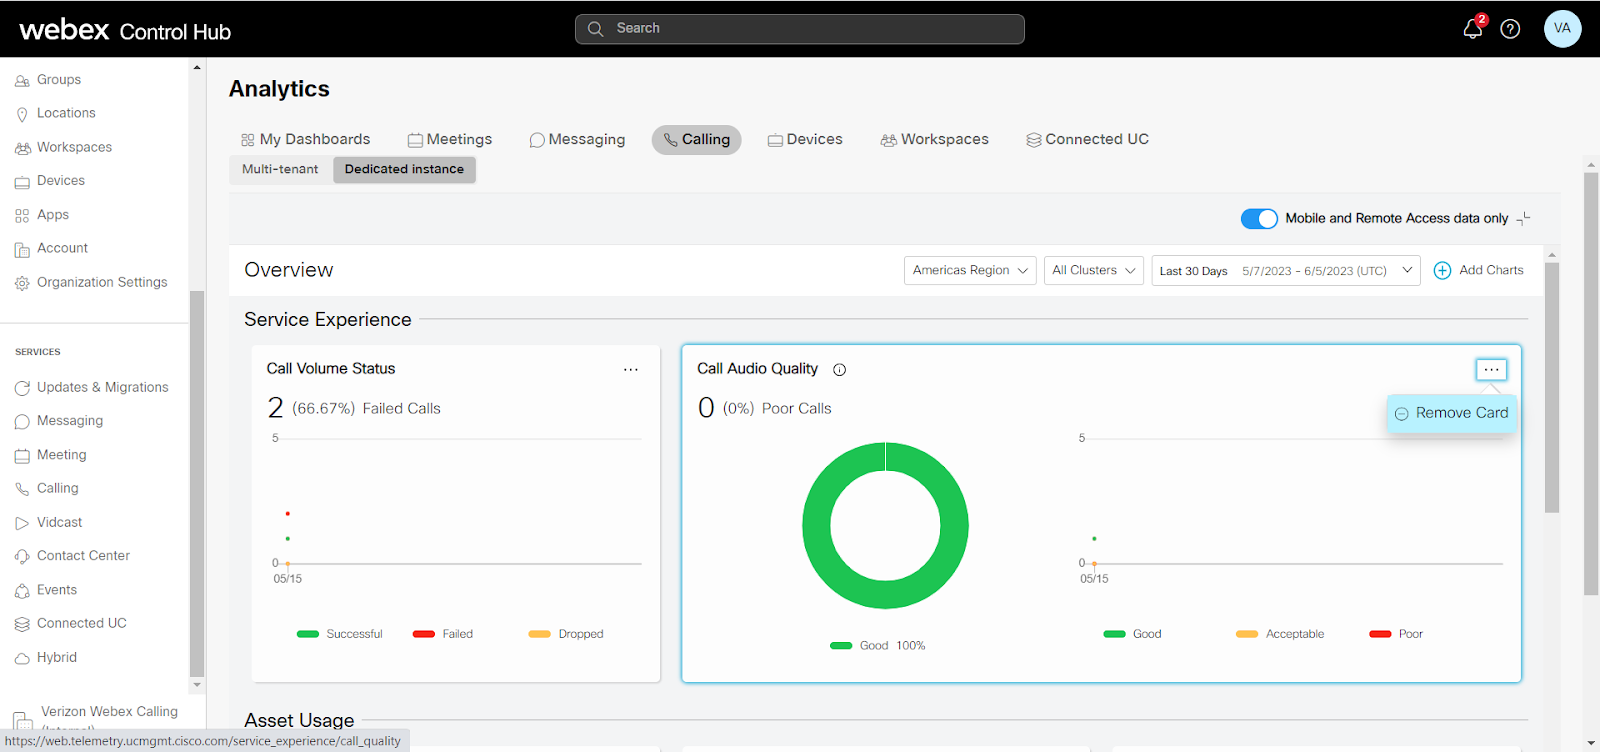
- Select a region from the region selection drop-down list. The default setting is All Regions.
The region represents the geographical location of the data centers configured during Dedicated Instance Activation. - Select a cluster from the cluster selection drop-down list.
The default setting is All Clusters. - To filter the data in the charts based on the time period, click the drop-down list.
You can view the charts for the period you have selected. The default time range is Last 30 Days. - Click the Add Charts option to add additional charts. Select the chart you want to add from the available charts.
- You can also remove a card. Click the three dots at the top right corner of a card and select Remove Card.
Download Analytics
You can export the data that is displayed in the charts into an Excel file using the Download button.
- Select the chart and click Download.
- You must wait until the Excel report is downloaded or the download fails.
